Physical Address
304 North Cardinal St.
Dorchester Center, MA 02124
Physical Address
304 North Cardinal St.
Dorchester Center, MA 02124

The Last High Low Stop Loss Indicator is one of the most practical and powerful tools traders use to manage risk in financial markets. Whether you’re trading stocks, forex, crypto, or commodities, controlling losses is just as important as making profits. This indicator helps traders set stop-loss levels based on recent market highs and lows, making risk management more structured and logical.
If you’ve ever wondered where to place your stop loss without guessing, this guide will walk you through everything you need to know.


4
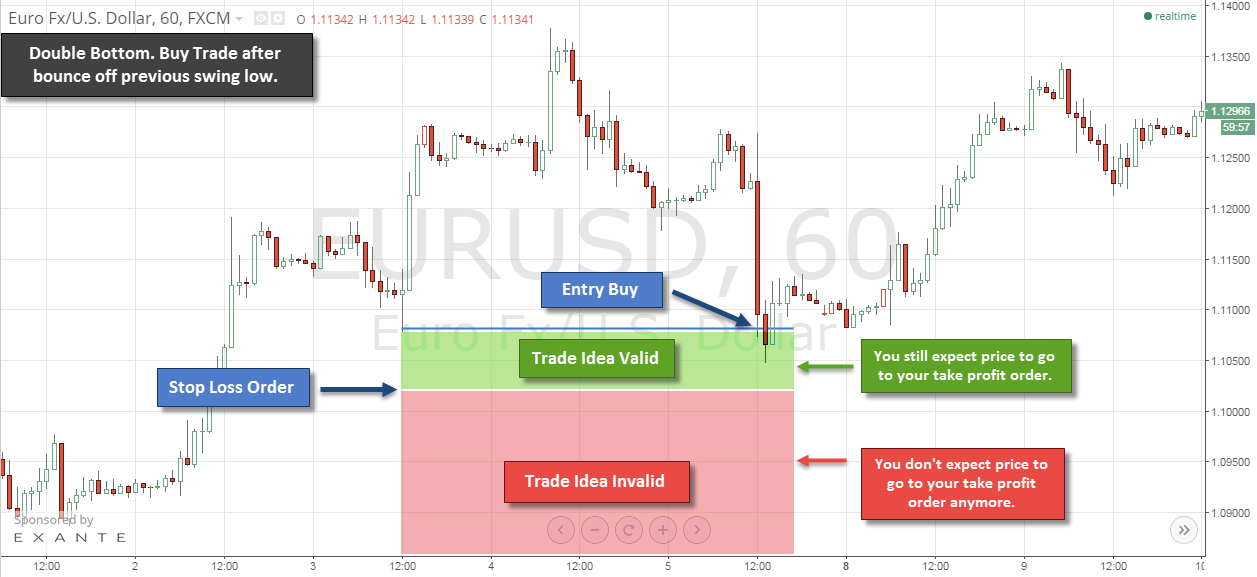
The Last High Low Stop Loss Indicator is a technical analysis tool that places stop-loss levels at the most recent swing high or swing low on a price chart.
In simple terms:
This method follows natural market structure instead of random pip distances or fixed percentages.
Markets move in waves:
This indicator uses that structure to determine logical exit points.
The indicator scans recent price movements and identifies:
These levels act as natural support and resistance zones.
If price makes higher highs and higher lows:
This protects the trade while allowing room for price fluctuations.
If price makes lower highs and lower lows:
It ensures you’re exiting only when the structure breaks.
No guesswork. You’re placing stops where market structure breaks.
Unlike fixed stops, this method adjusts automatically based on price swings.
Because entries are based on structure, traders can better calculate risk versus potential reward.
You can use it on:


4
Most trading platforms support swing high/low tools or allow custom indicators.
Popular platforms include:
For deeper technical learning, you can explore educational resources like Investopedia.
Let’s imagine you’re trading EUR/USD:
If price breaks below that low, the uptrend structure is invalidated. That’s your exit signal.
This method keeps your losses controlled and logical.
The Last High Low Stop Loss Indicator works across multiple timeframes:
| Timeframe | Suitable For | Risk Level |
|---|---|---|
| 1M – 15M | Scalping | High |
| 1H – 4H | Day Trading | Moderate |
| Daily | Swing Trading | Lower |
| Weekly | Position Trading | Low |
Higher timeframes generally provide stronger structural levels.
Markets often retest highs and lows. Give some breathing room.
During high-impact news events, swings may be exaggerated.
Risk percentage should remain consistent per trade.
Always confirm trend direction before relying on swing levels.
Instead of a fixed stop:
This locks in profits while allowing trends to run.
This technique is widely used by professional traders.
Absolutely.
It teaches:
However, beginners should practice on demo accounts before live trading.
Yes, when used with proper trend analysis. It reflects real market structure rather than random stop placement.
Yes. Many platforms allow automated scripts or Expert Advisors to implement this method.
It’s less effective in choppy markets because swing highs and lows frequently break.
Most professionals risk 1–2% of account balance per trade.
It depends. ATR adapts to volatility, while this indicator adapts to structure. Some traders combine both.
Yes. It works well with:
The Last High Low Stop Loss Indicator is a simple yet powerful risk management tool. By aligning your stop loss with real market structure, you trade smarter—not harder. It removes emotional decisions and replaces them with logic.
If you’re serious about improving consistency, this method can dramatically enhance your trading discipline.



